
1 / 15
2 / 15
3 / 15

4 / 15
5 / 15

6 / 15

7 / 15
8 / 15
9 / 15
10 / 15
11 / 15
12 / 15
13 / 15
14 / 15
15 / 15
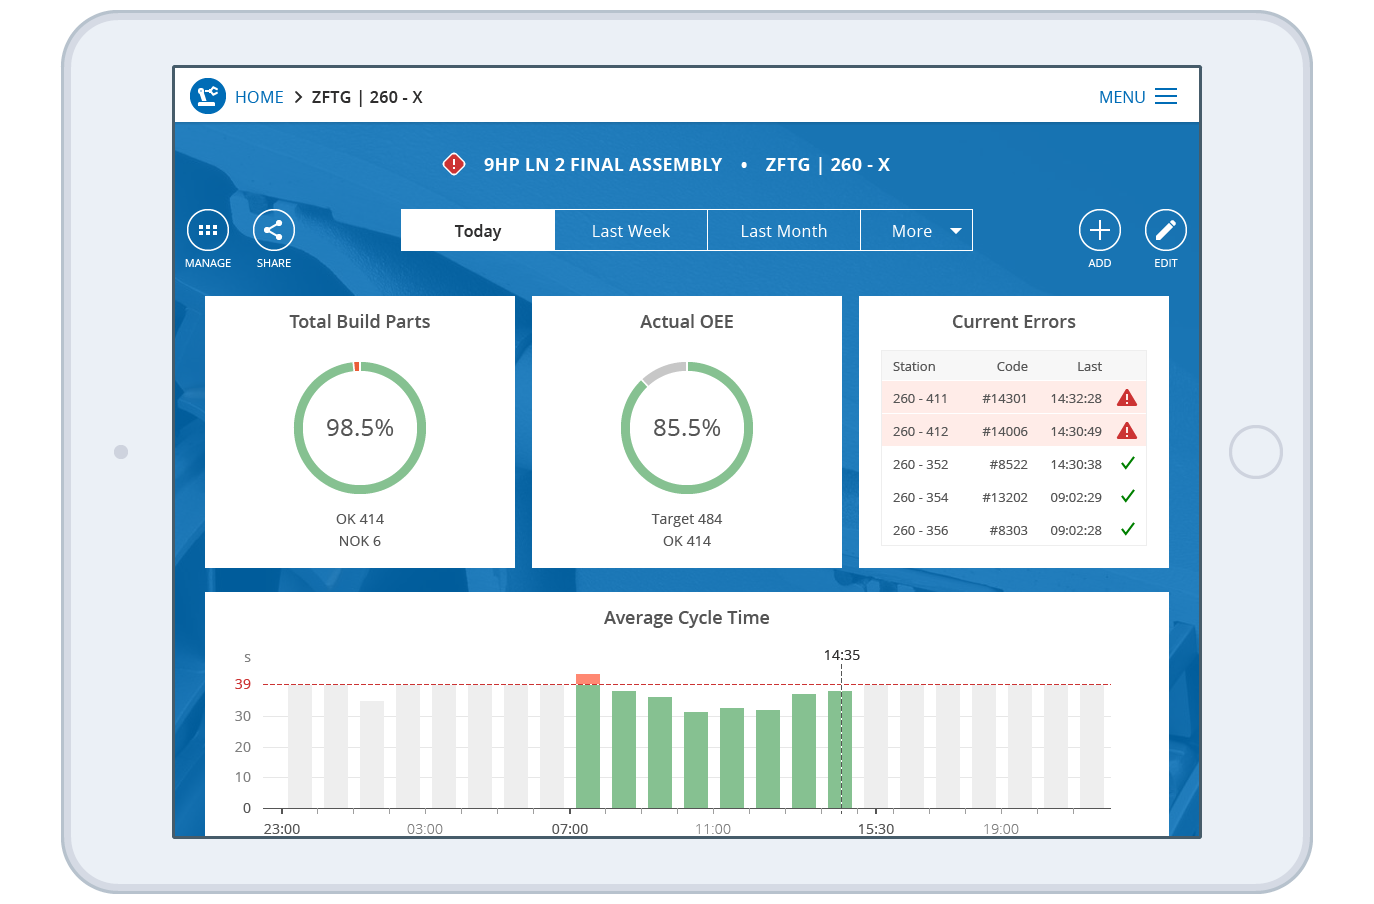
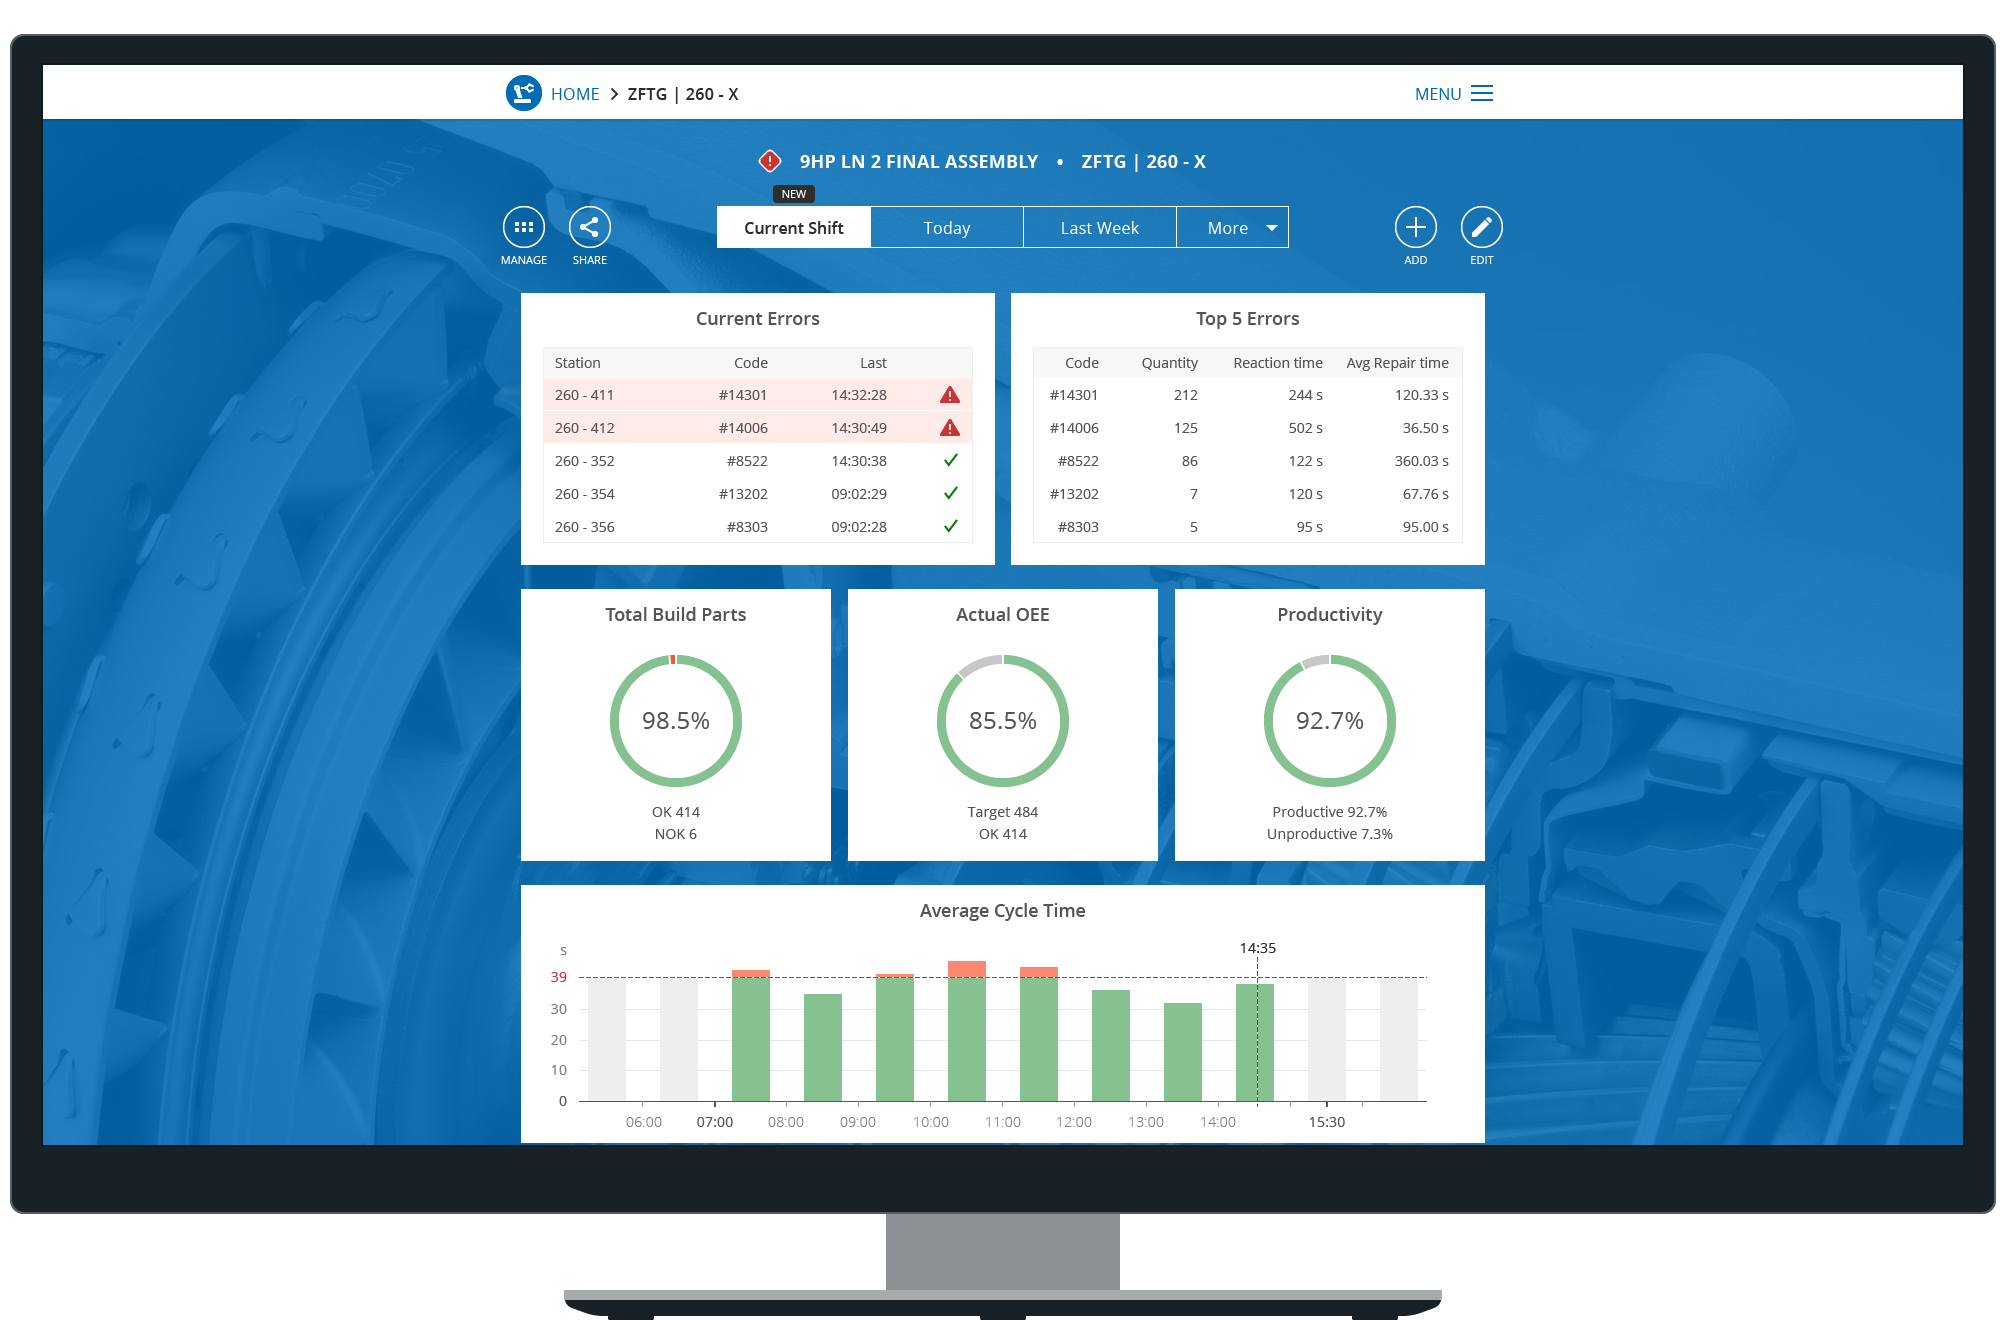
1 / 15Factory production monitoring: dashboard for the current day
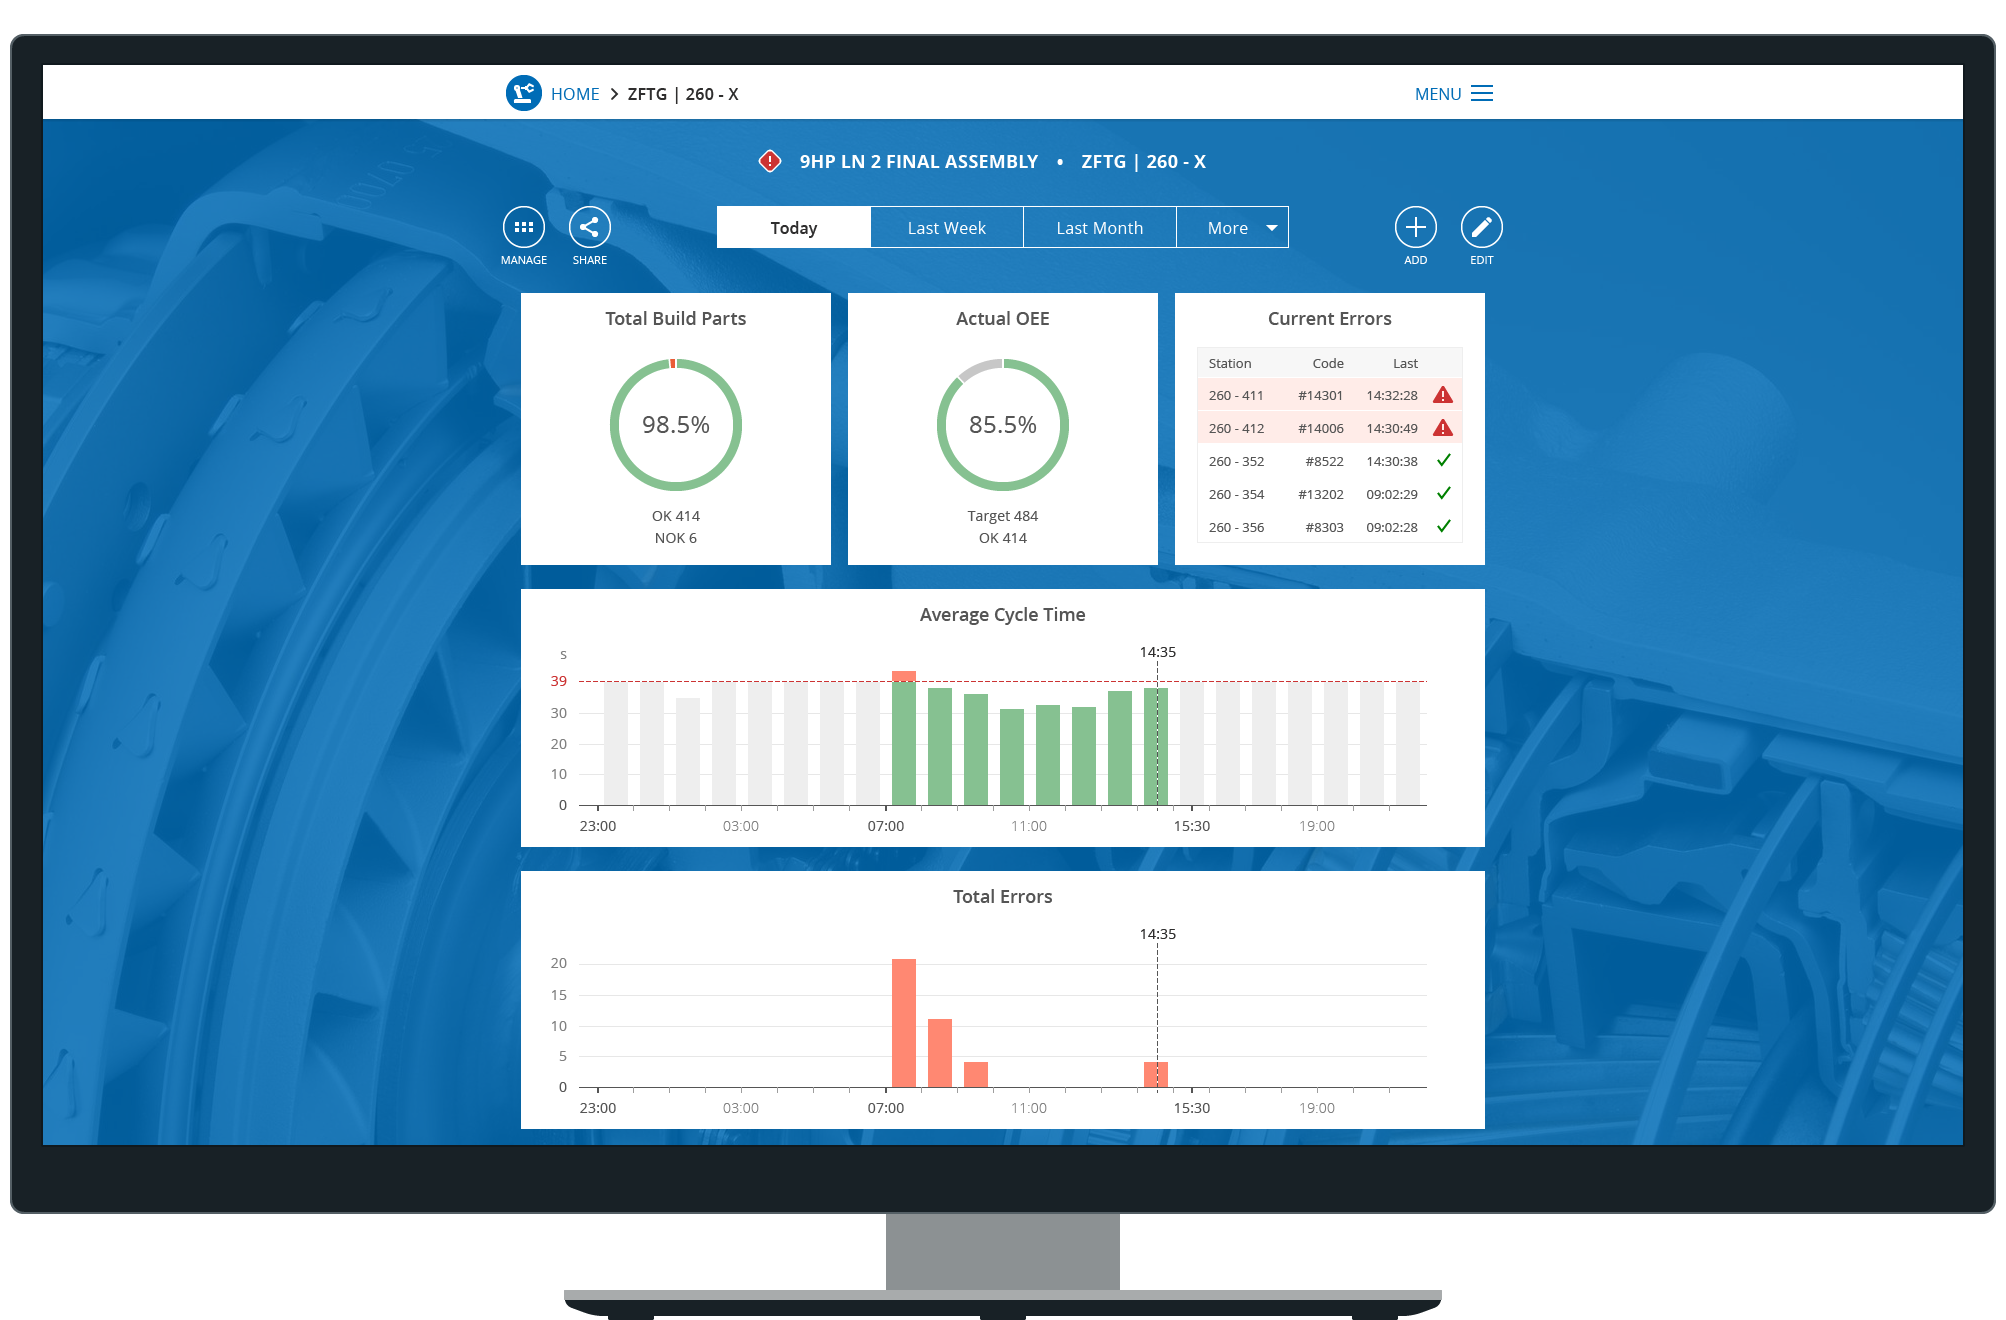
2 / 15Dashboard for the current day on a desktop machine
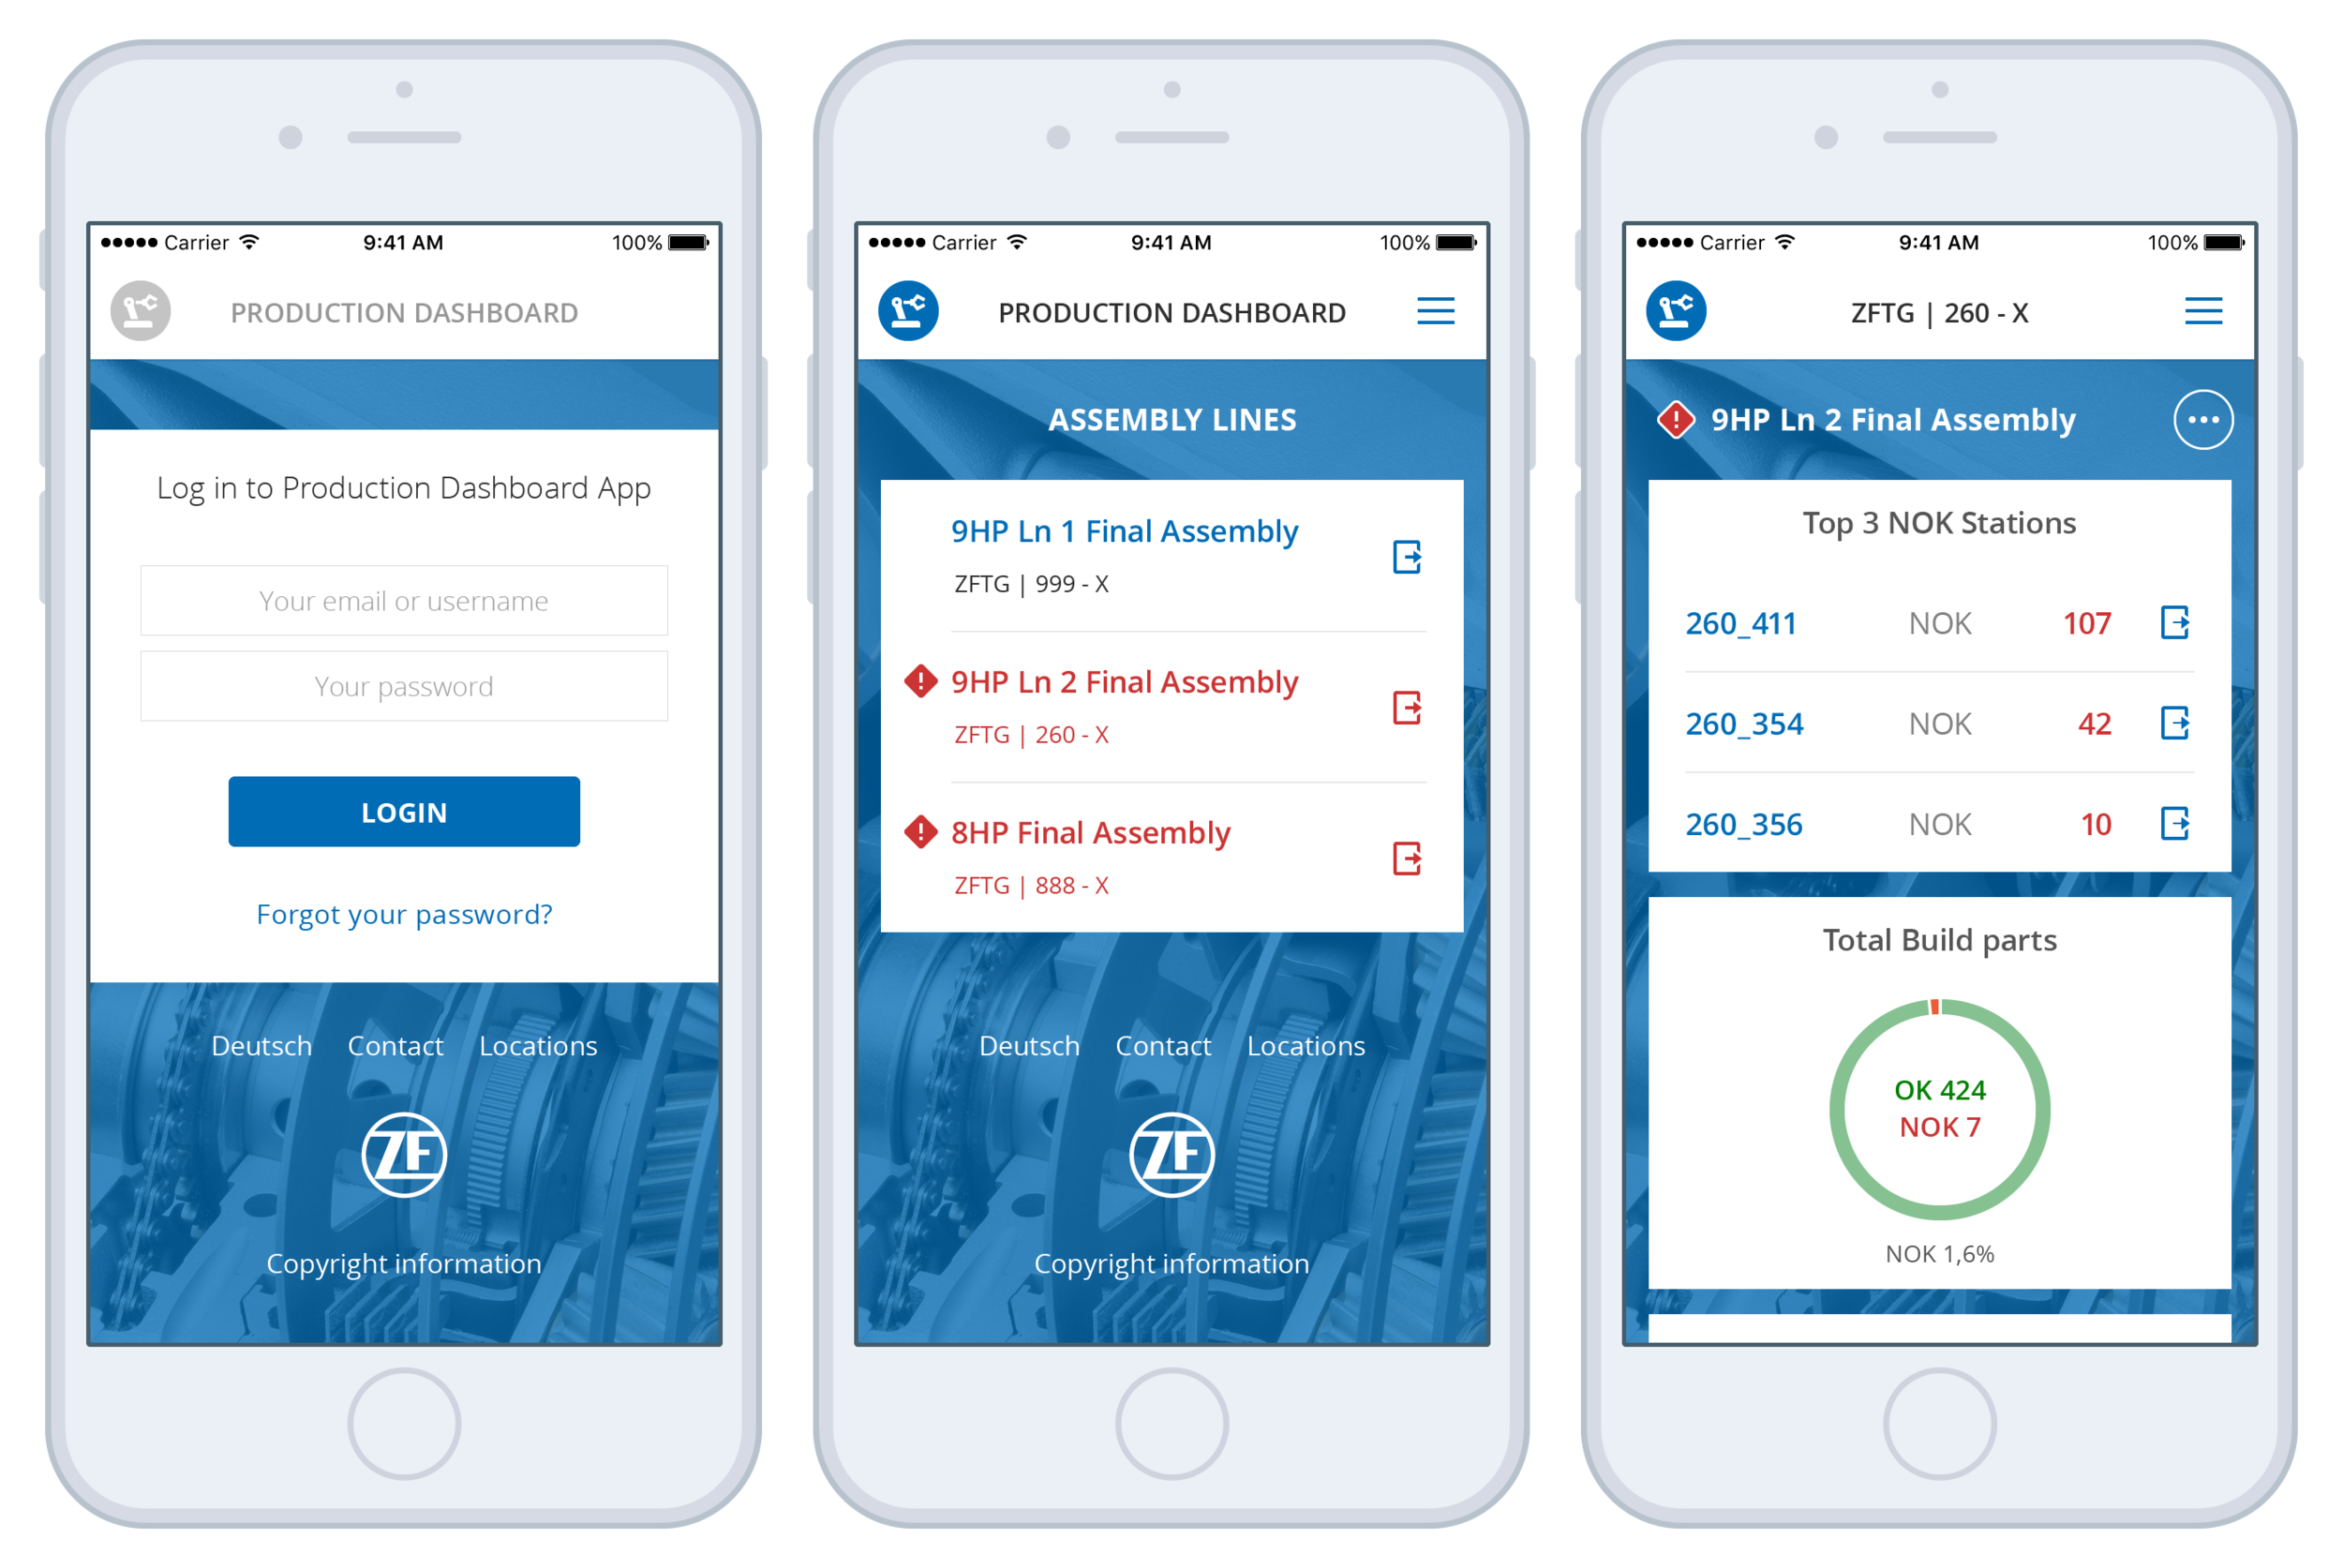
3 / 15iPhone application: login page, assembly lines list and monitoring page
4 / 15Mobile menu, push notification with deep link to the problem, and mobile widgets
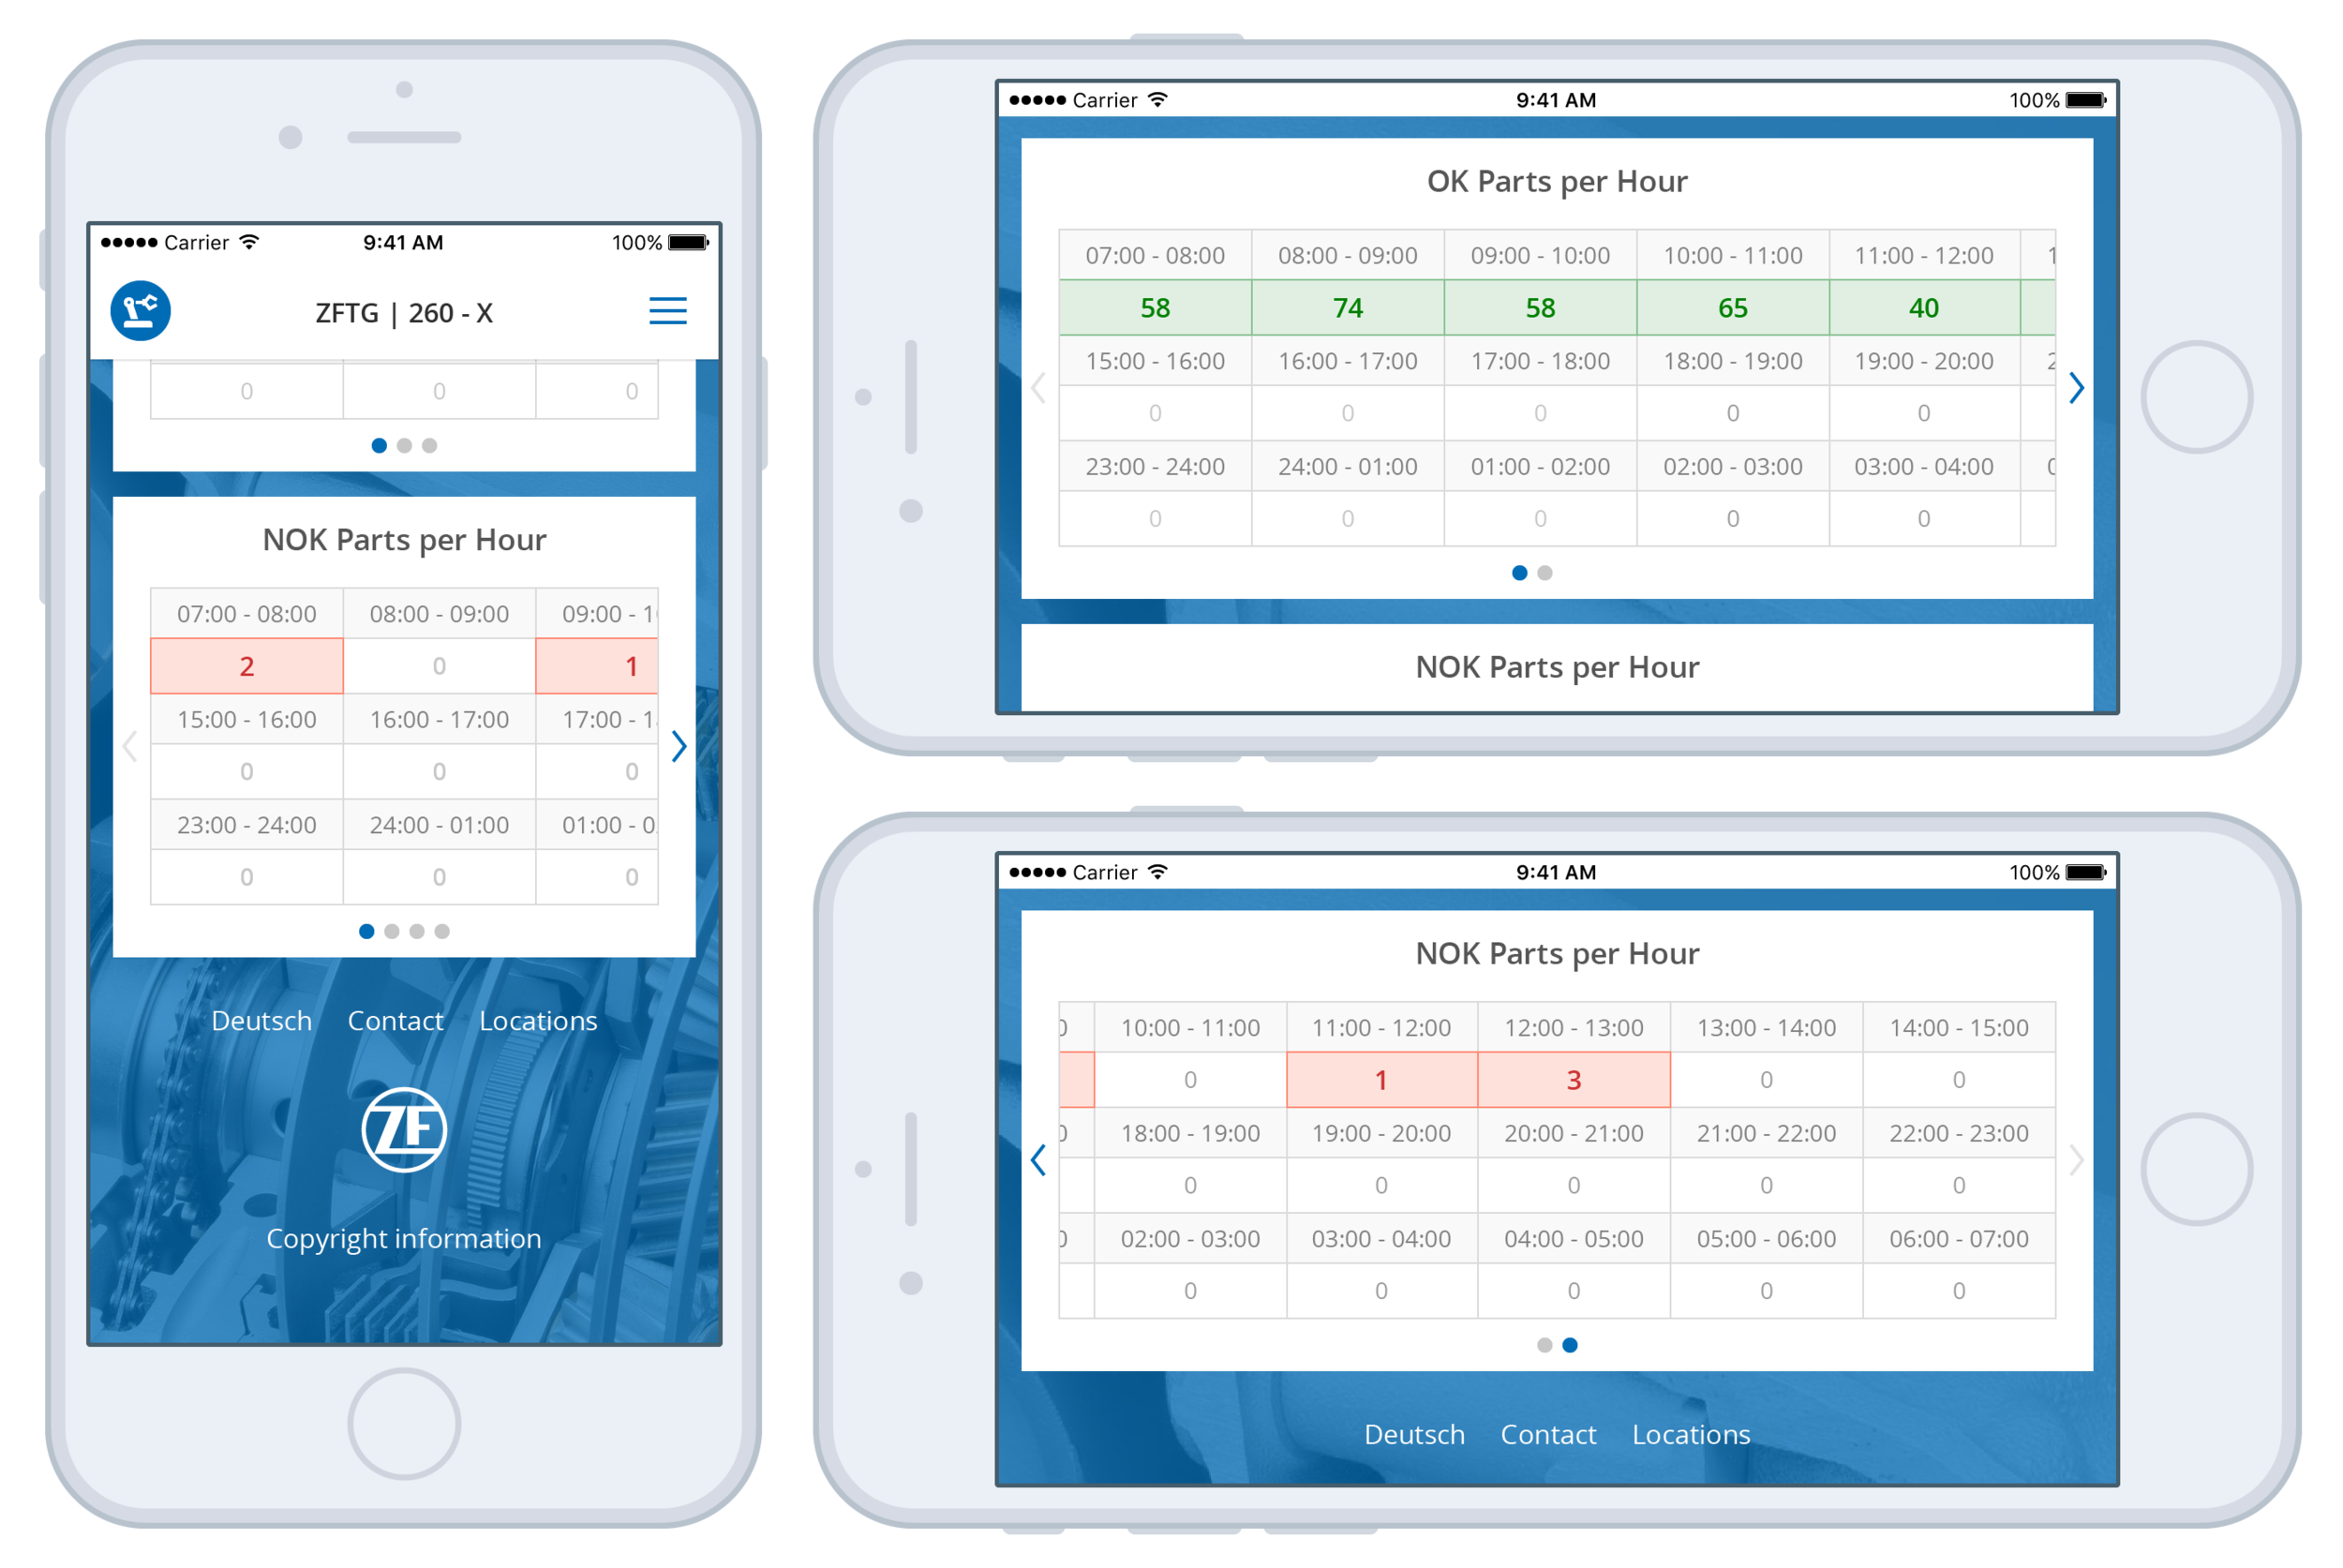
5 / 15Horizontal swiping and pagination on mobile widgets
6 / 15Responsive web login page on an iPad tablet
7 / 15Responsive web login page on a desktop monitor
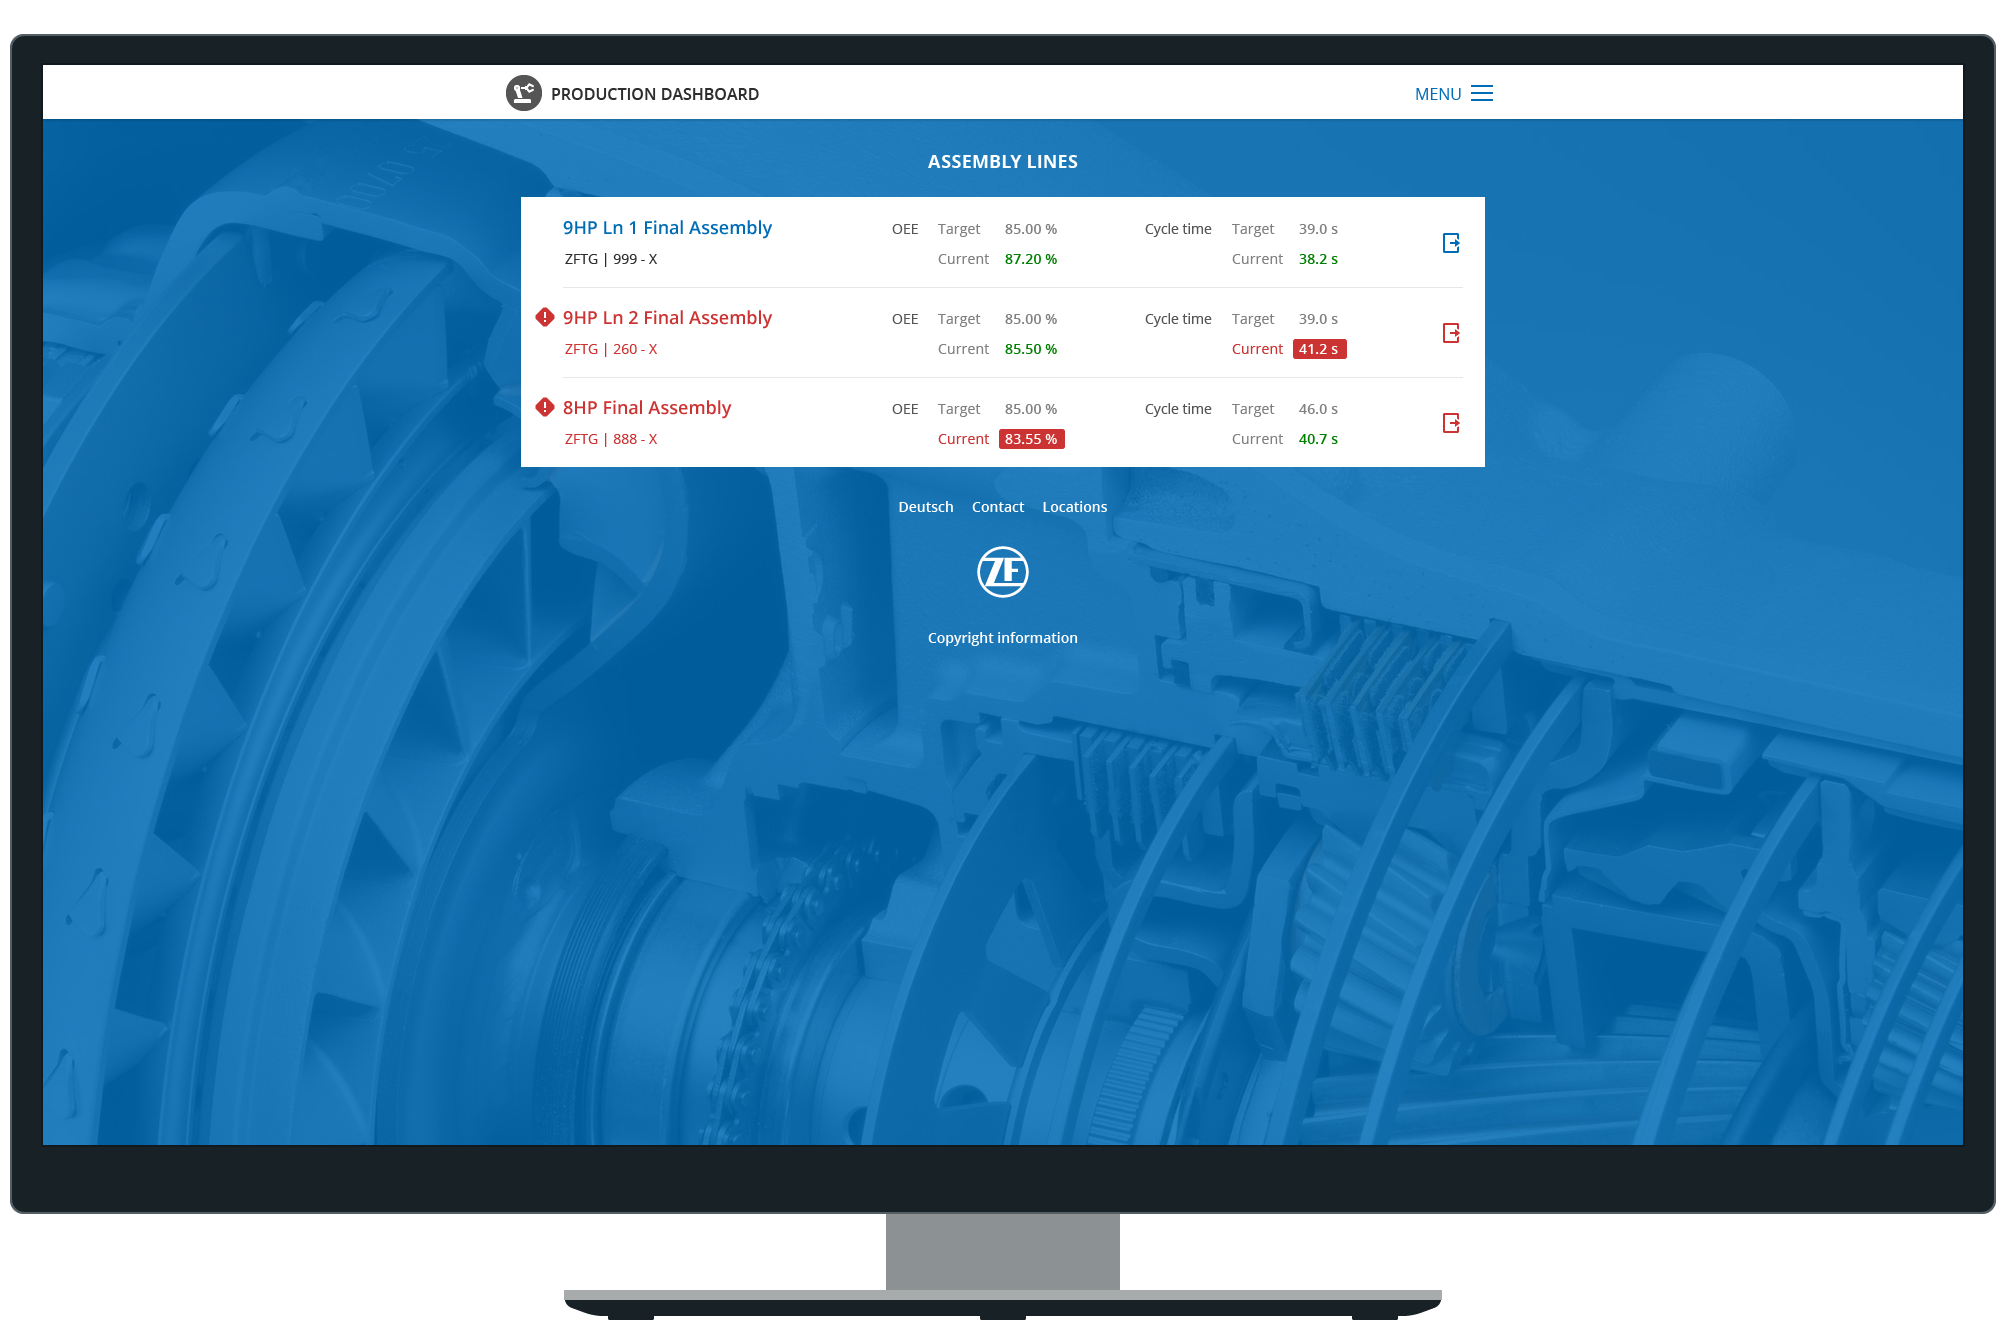
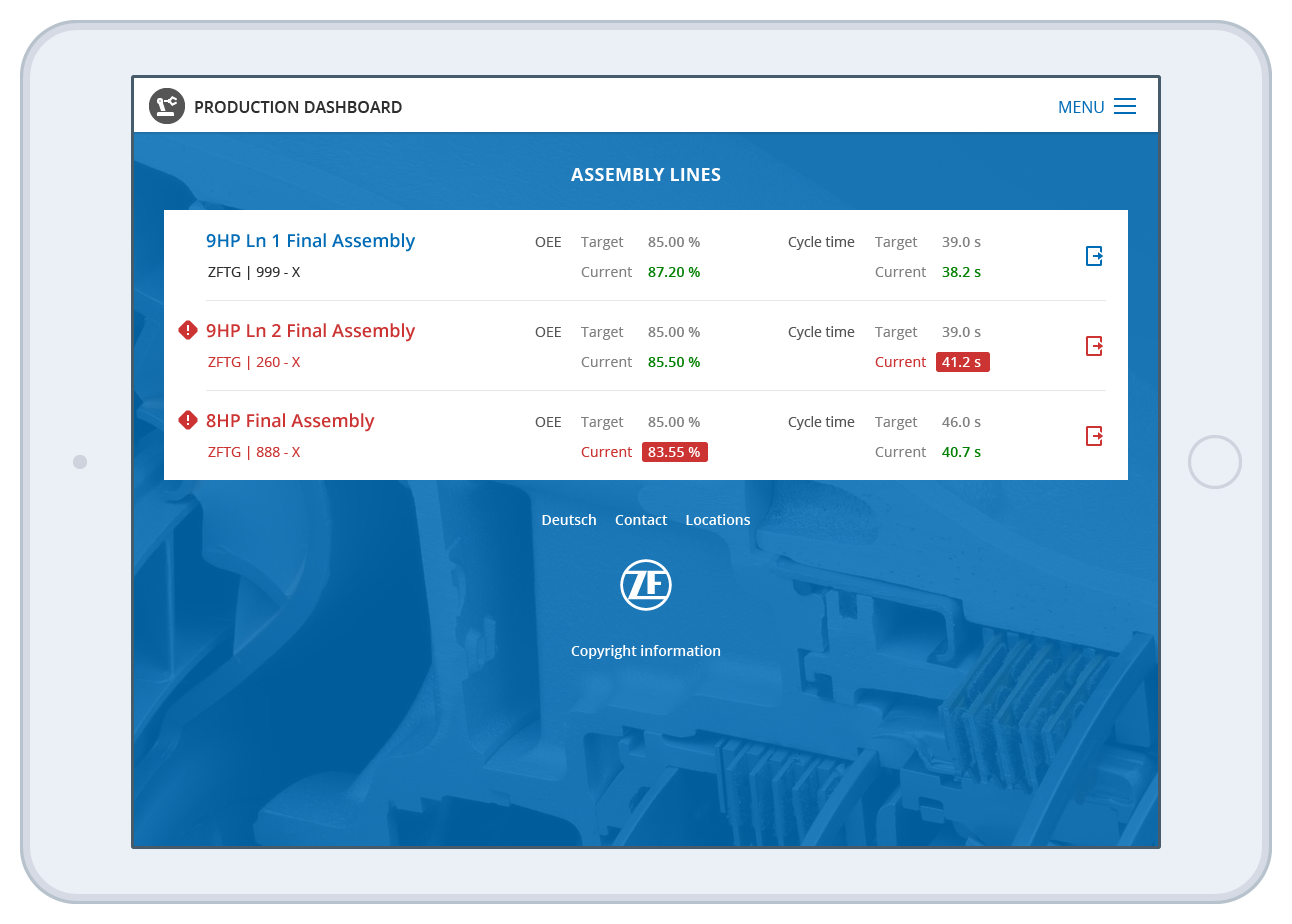
8 / 15Assembly lines in the factory. The problematic ones are highlighted.
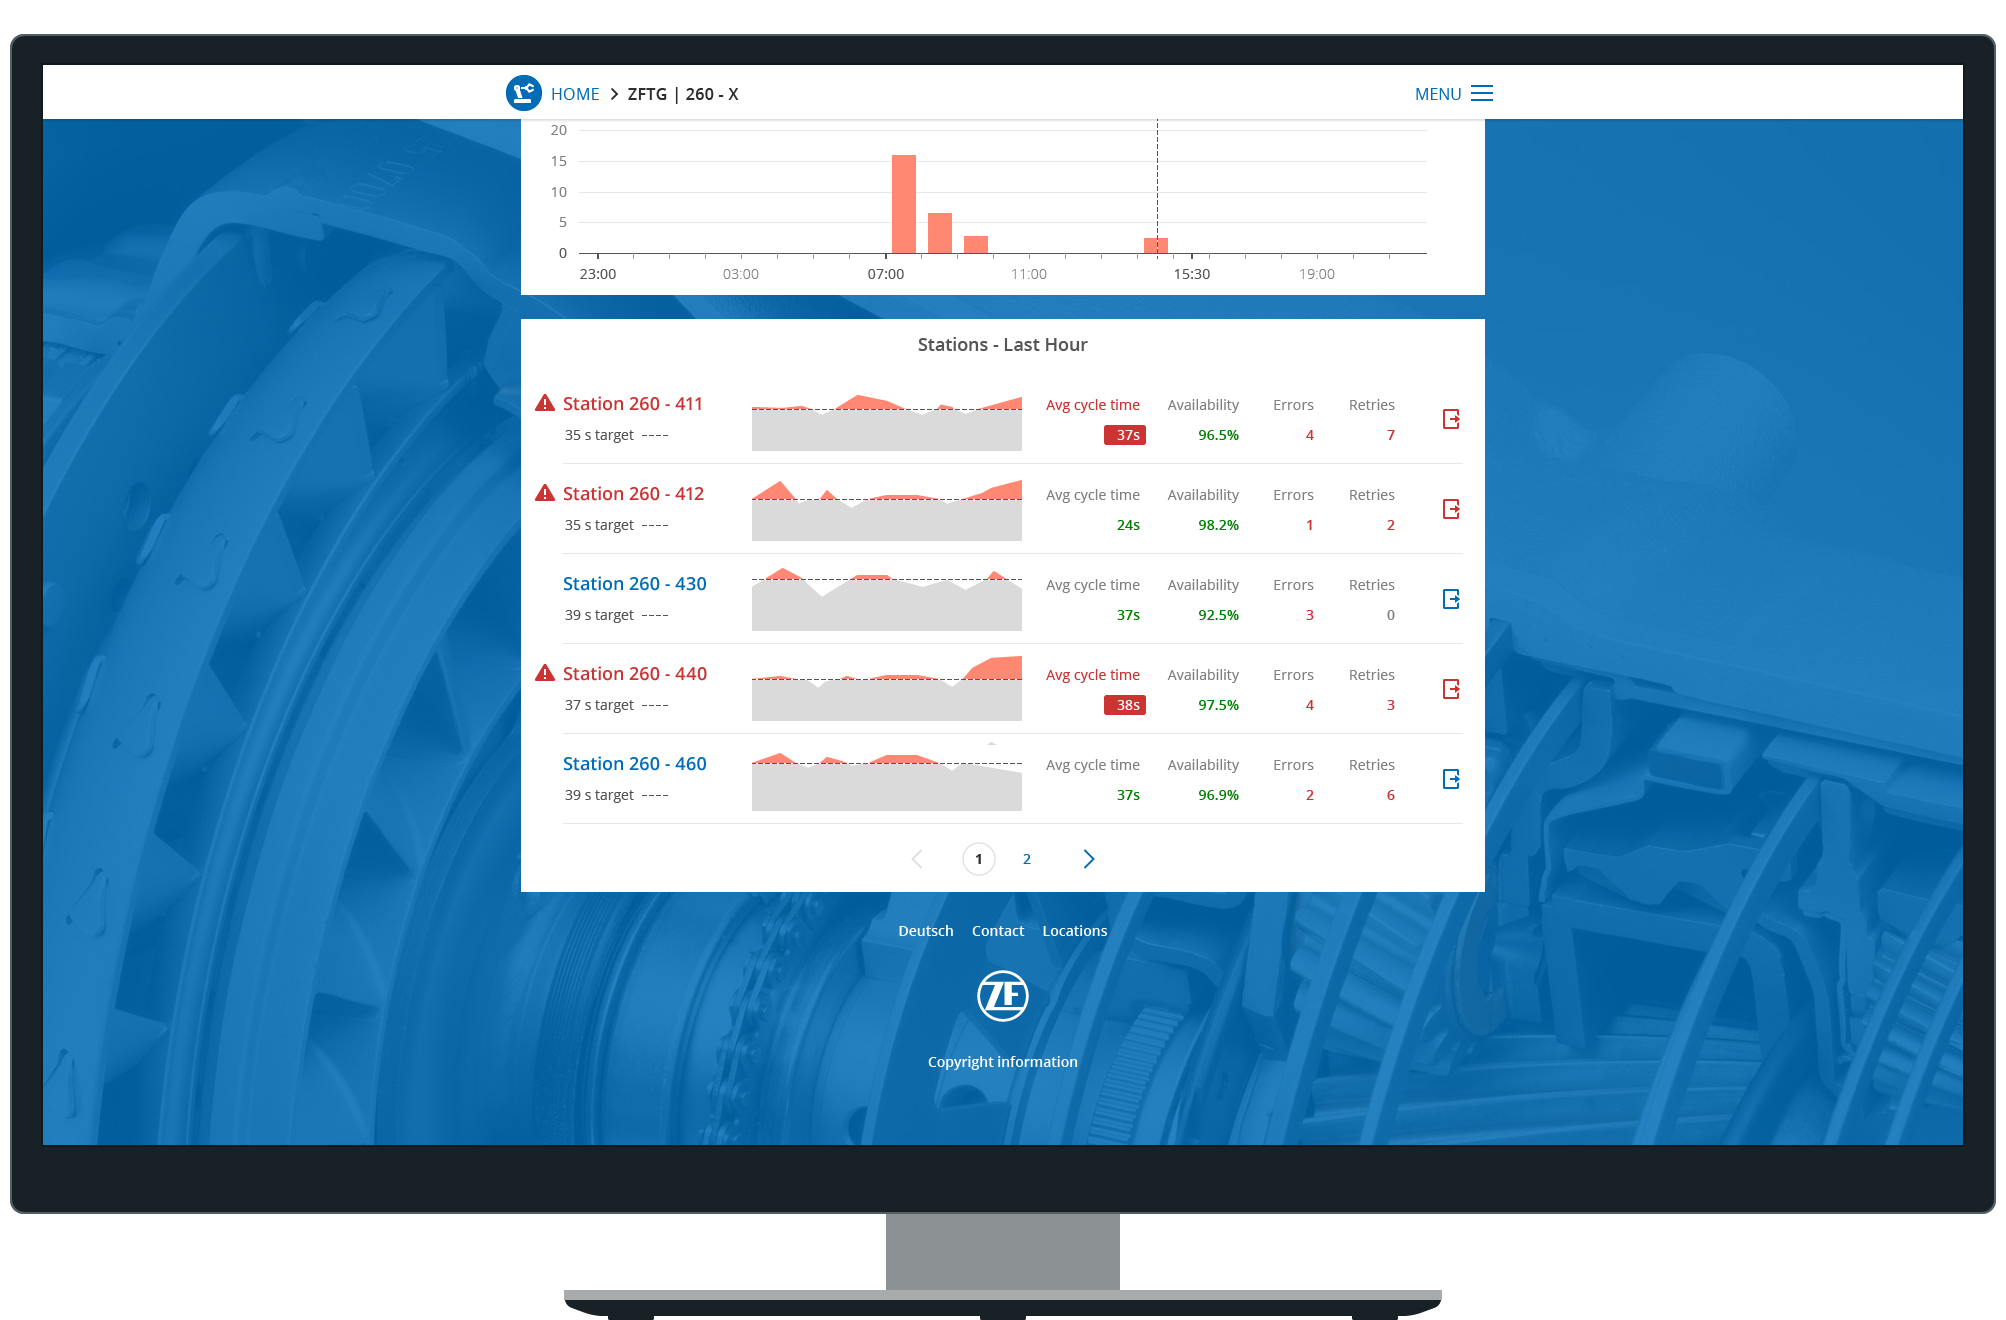
9 / 15Cut-off graph shows cycle times that exceed production targets
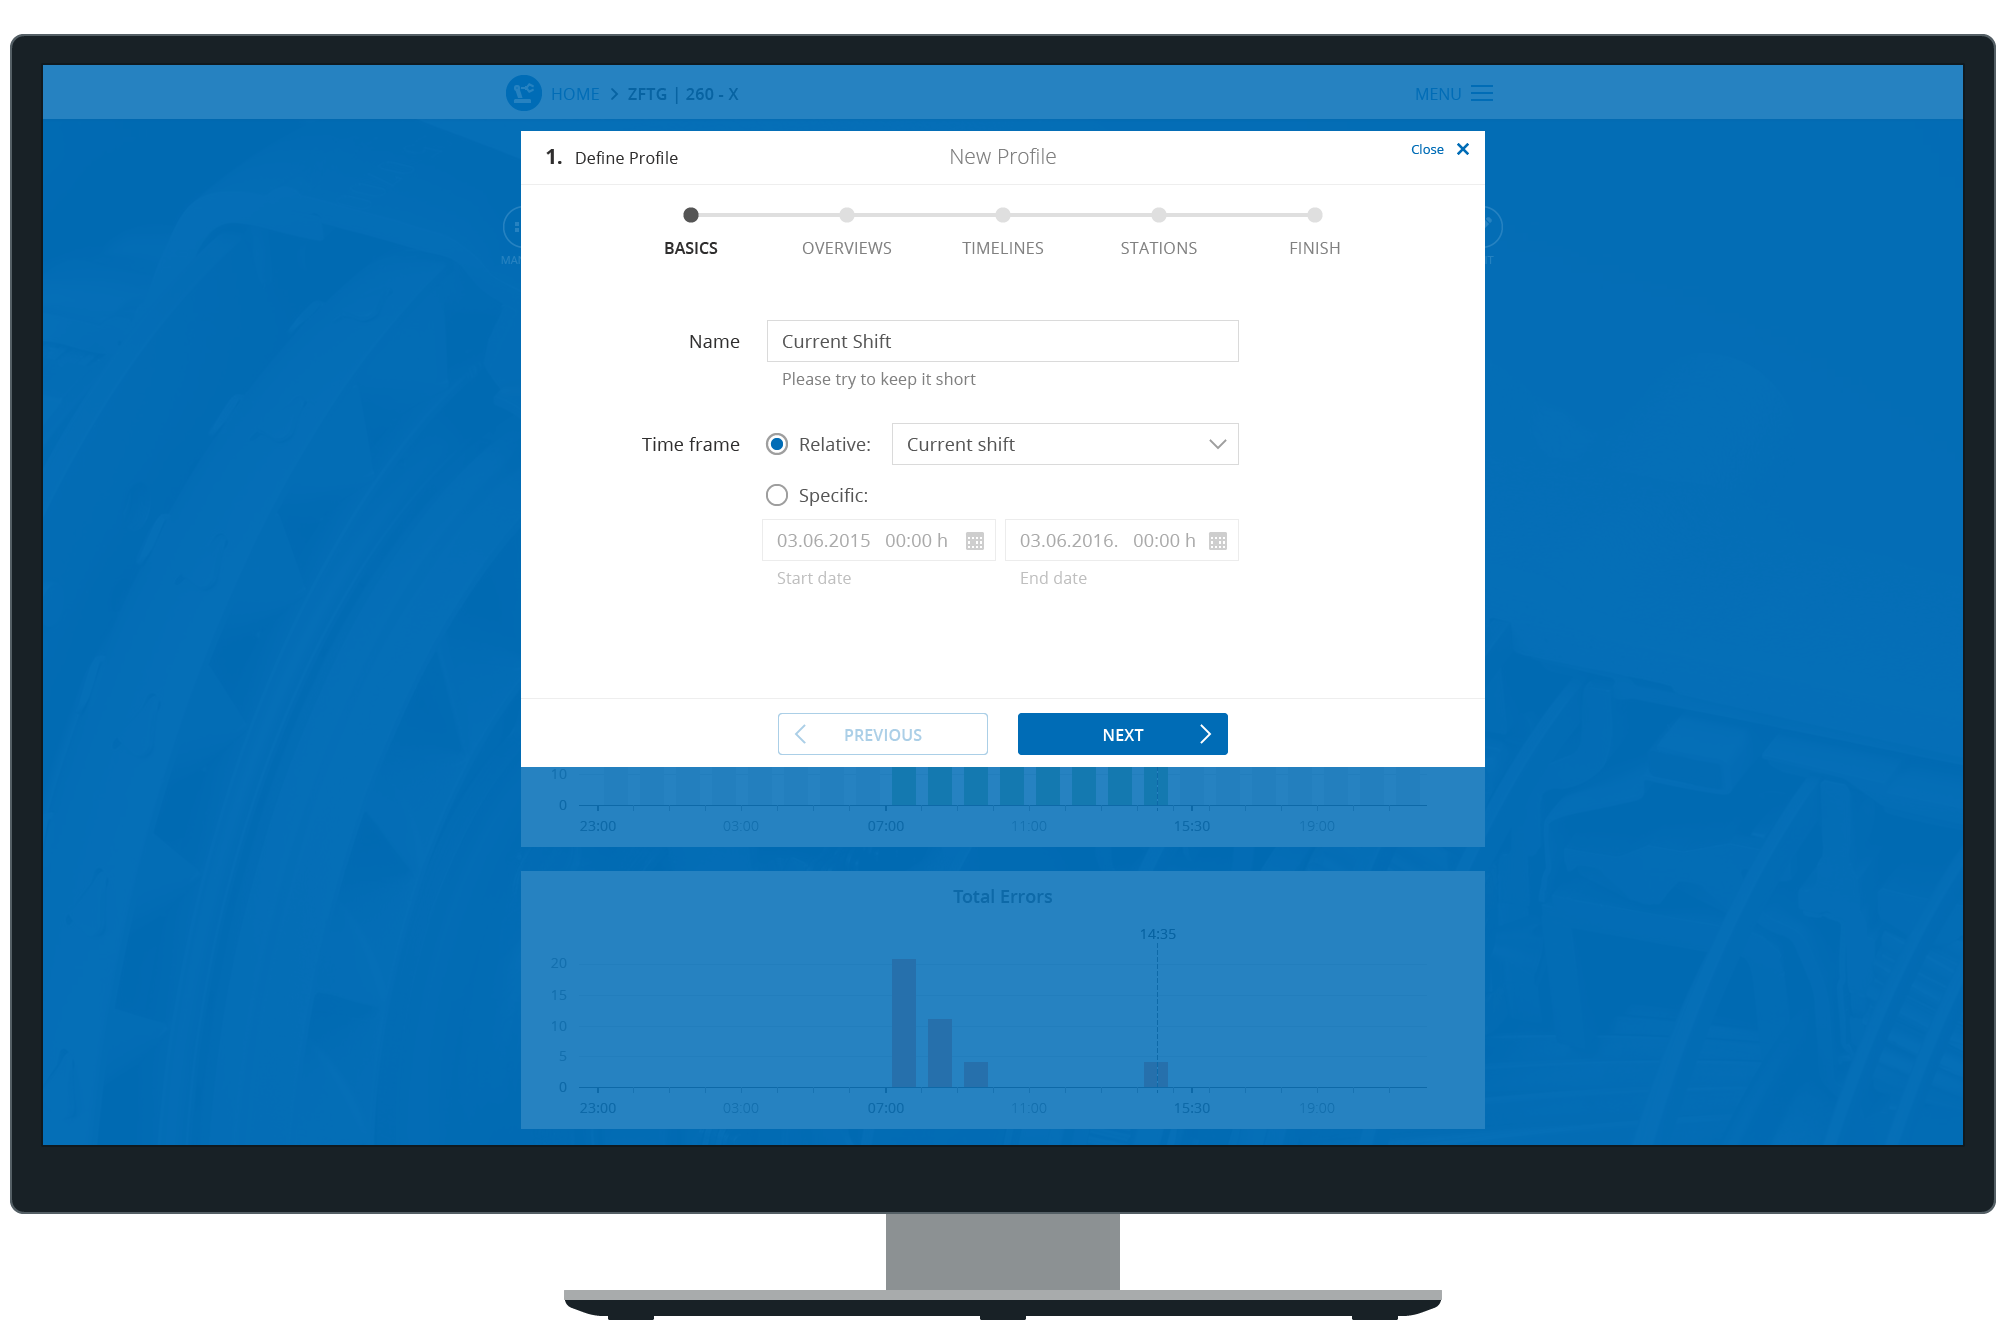
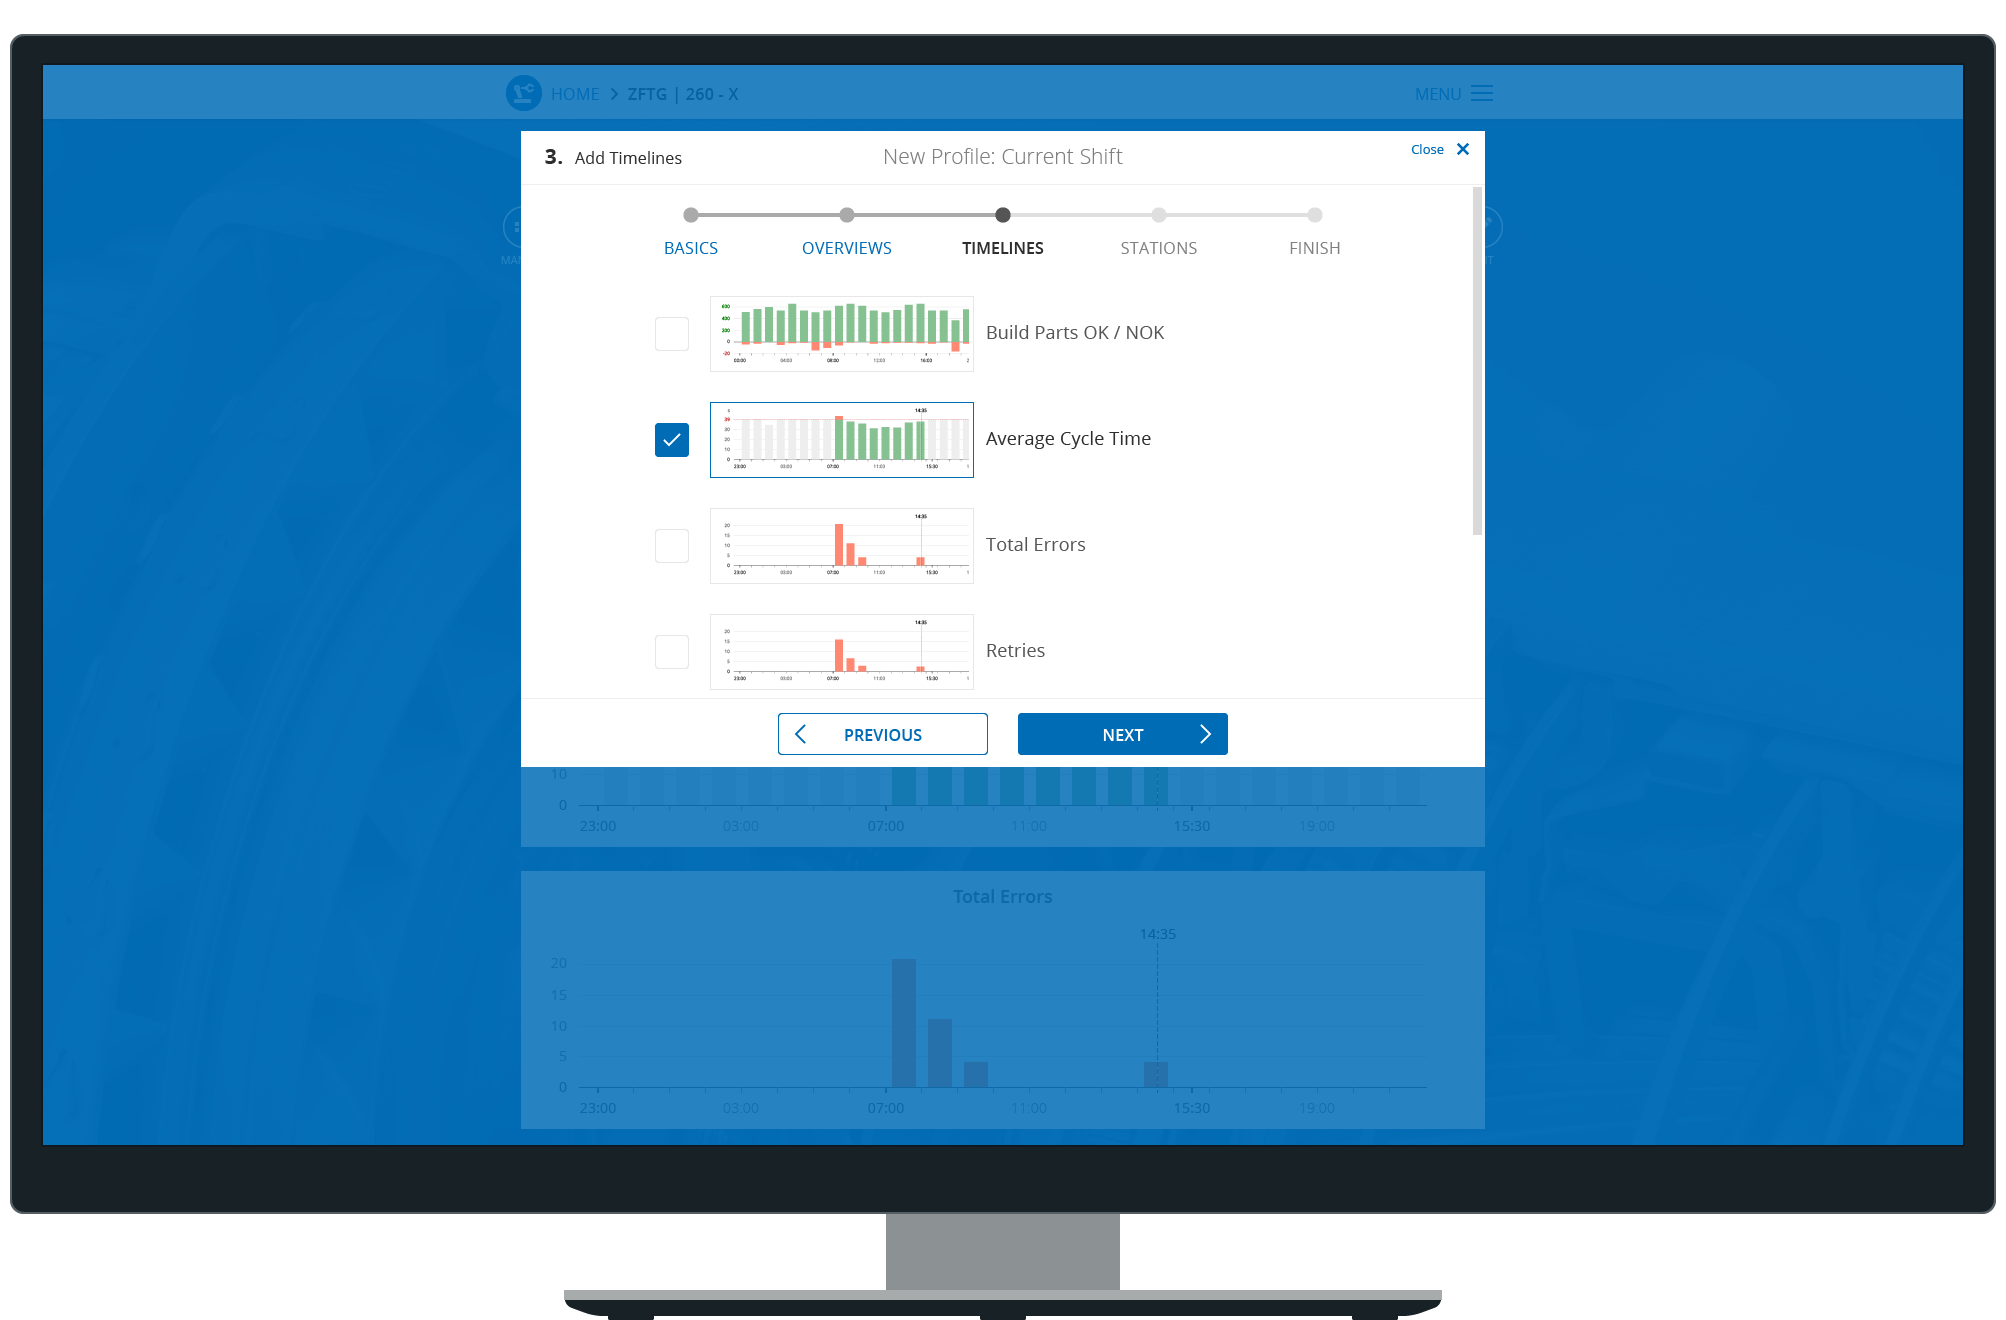
10 / 15Creation of a custom monitoring profile
11 / 15Configuration of the new monitoring profile
12 / 15New monitoring profile with a single-shift time span
13 / 15Assembly lines list view on an iPad
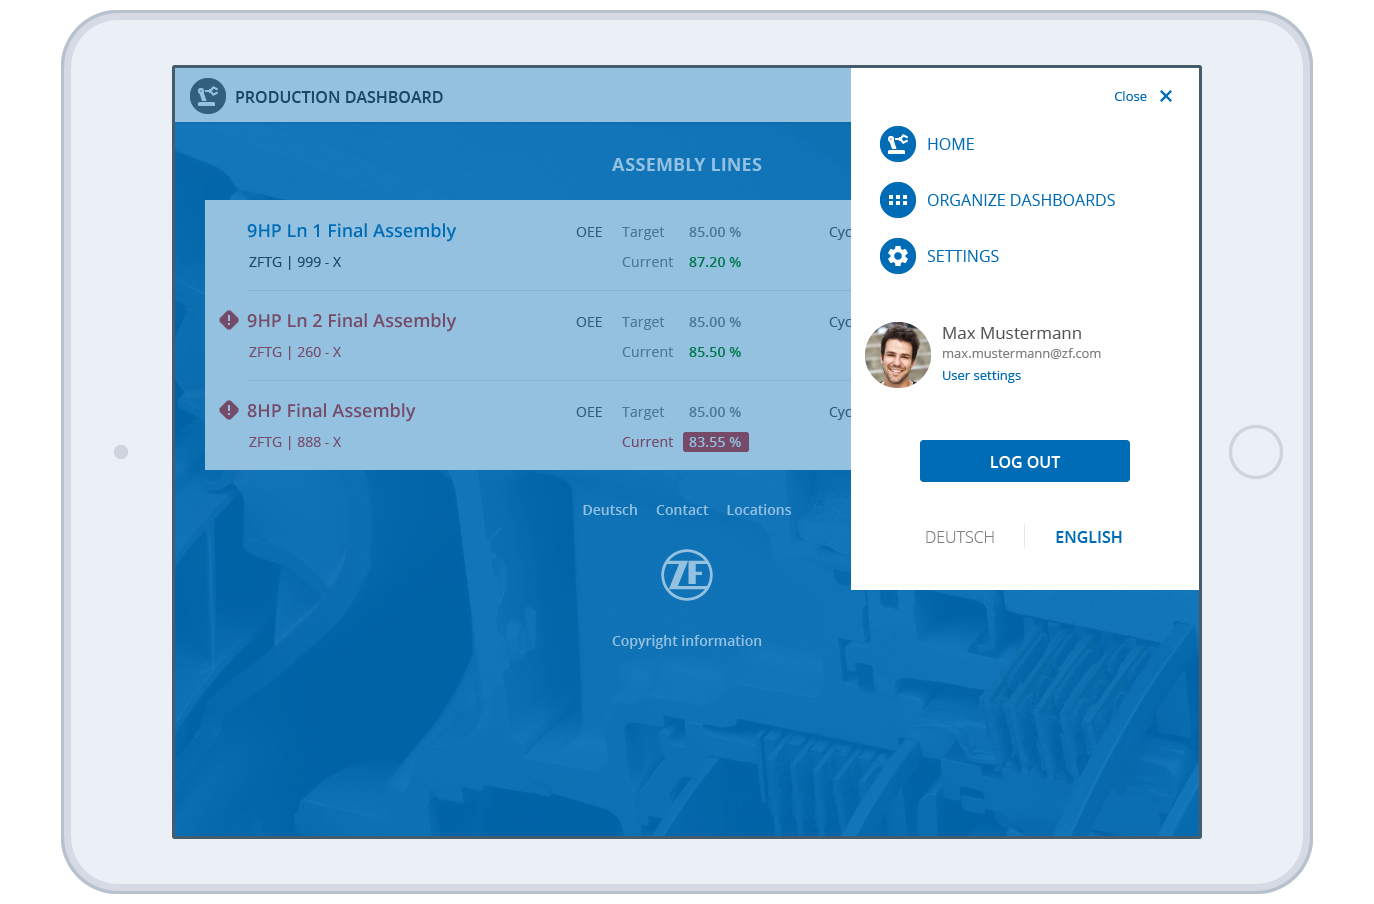
14 / 15Responsive web application menu opened on a tablet
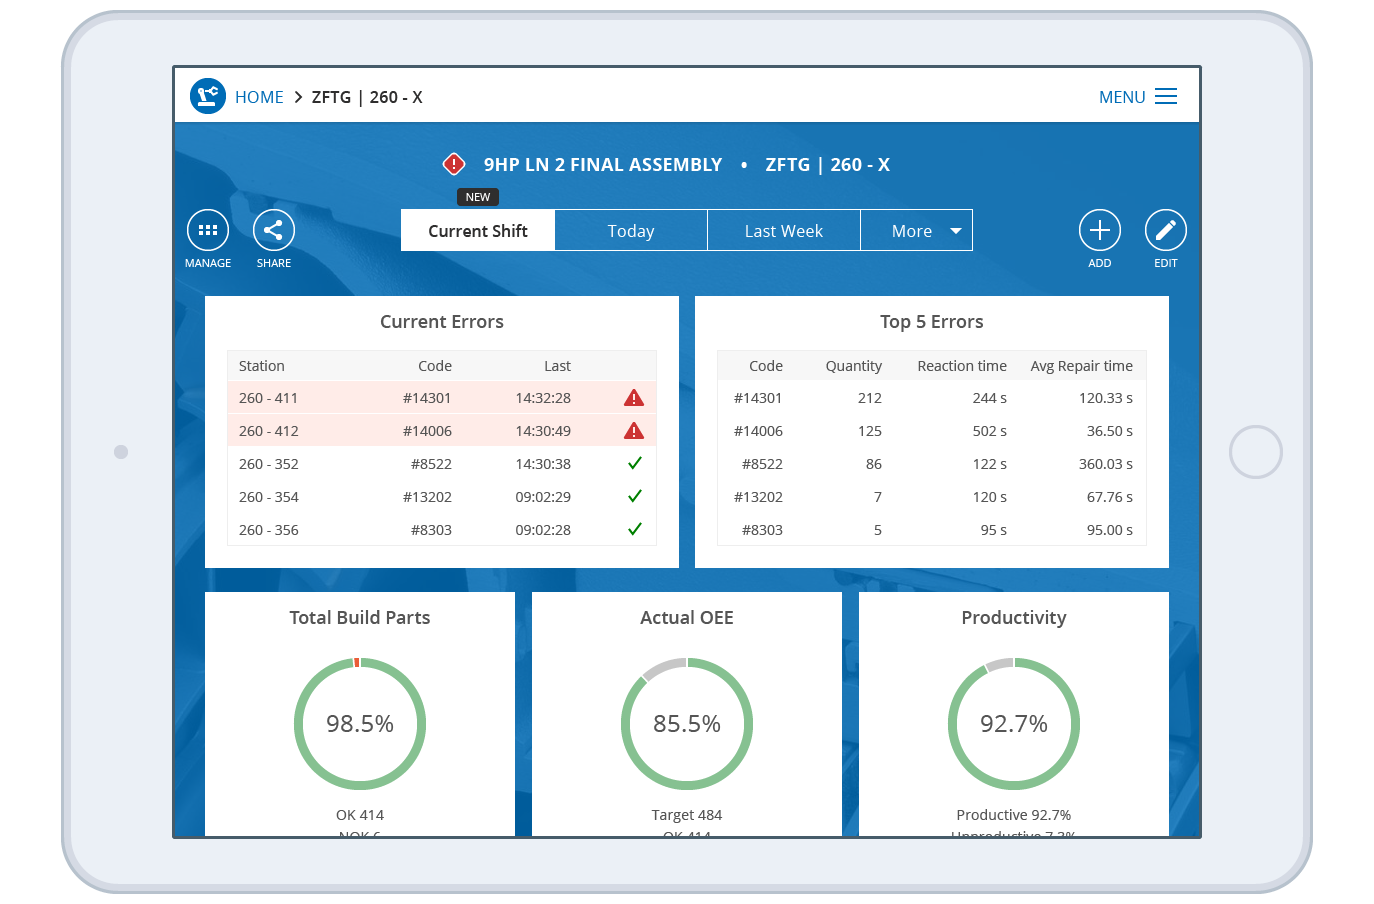
15 / 15Responsive screen: custom monitoring profile on a tablet
info
/
1
2
3
4
5
6
7
8
9
10
11
12
13
14
15
·
·
·
·
·
·
·
·
·
·
·
·
·
·
·